
ETF Fund Data
FUND NAME:
AMERICAN CONSERVATIVE VALUES ETF
TICKER:
ACVF
| doc | LAUNCH DATE | MANAGEMENT STYLE | total_net_assets | CUSIP | TOTAL GROSS EXPENSE RATIO | etfg_date | as_of_date | fund_ticker | fund_description | fund_isin | iopv_symbol | etf_issuer | number_of_holdings_in_etf | fund_listing_exchange | market_price | nav | discount_premium | fund_shares_outstanding | thirty_day_median_bid_ask | premium_discount_days_q | premium_discount_days_y | two_per_premium_discount_no_of_days | two_per_premium_discount_5_days | two_per_premium_discount_6_days | two_per_premium_discount_7_days | etf_global_reward_score | etf_global_risk_score | asset_class | category | focus | development_class | region | geographic_exposure | currency_exposure | sector_exposure | industry_group_exposure | industry_exposure | sub_industry_exposure | last_nb_bid | last_nb_ask | last_nb_mid | last_nb_time | previous_cal_q_pd_premium | previous_cal_q_pd_discount | previous_cal_q_pd_total | previous_cal_y_pd_premium | previous_cal_y_pd_discount | previous_cal_y_pd_total | current_cal_q_pd_premium | current_cal_q_pd_discount | current_cal_q_pd_total | current_cal_y_pd_premium | current_cal_y_pd_discount | current_cal_y_pd_total | discount_premium_in_currency | discount_premium_currency | two_per_premium_discount_7plus_days_in_365_days |
|---|---|---|---|---|---|---|---|---|---|---|---|---|---|---|---|---|---|---|---|---|---|---|---|---|---|---|---|---|---|---|---|---|---|---|---|---|---|---|---|---|---|---|---|---|---|---|---|---|---|---|---|---|---|---|---|---|---|
| ACV ETF Fund Data | 10/29/2020 | 0.00 | 26923N108 | 0.75 | 07/23/2026 | 07/23/2026 | ACVF | American Conservative Values ETF | US26923N1081 | ACVF.IV | Ridgeline Research, LLC | 392 | NYSE Arca, Inc. | 53.25 | 53.31 | -0.11% | 2,825,000.00 | 0.09% | 62 | 249 | 0 | f | f | f | Equity | Strategy | Theme | Developed Markets | North America | US=0.952;IE=0.024;CH=0.009;LU=0.004;CA=0.003;NL=0.002;LR=0.001;JE=0.001;BM=0.000 | USD=0.929 | Technology=0.398;Financials=0.119;Industrials=0.111;Consumer Discretionary=0.102;Health Care=0.086;Consumer Staples=0.054;Communications=0.037;Utilities=0.020;Energy=0.018;Real Estate=0.017;Materials=0.014 | Semiconductors & Semiconductor Equipment=0.204;Software & Services=0.122;Capital Goods=0.075;Technology Hardware & Equipment=0.067;Diversified Financials=0.058;Pharmaceuticals, Biotechnology & Life Sciences=0.052;Retailing=0.047;Consumer Services=0.039;Health Care Equipment & Services=0.034;Insurance=0.030;Banks=0.028;Food, Beverage & Tobacco=0.025;Utilities=0.020;Media & Entertainment=0.020;Energy=0.018;Food & Staples Retailing=0.018;Transportation & Logistics=0.017;Real Estate=0.016;Materials=0.014;Automobiles & Components=0.013;Telecommunication Services=0.013;Commercial & Professional Services=0.011;Consumer Durables & Apparel=0.011;Household & Personal Products=0.009;Transportation=0.004;Technology Hardware & Equipmen=0.003;Financial Services=0.003;Consumer Discretionary Distribution=0.000 | Semiconductors & Semiconductor Equipment=0.204;Software=0.094;Specialty Retail=0.064;Communications Equipment=0.047;Biotechnology=0.047;Capital Markets=0.038;Hotels, Restaurants & Leisure=0.030;Insurance=0.030;IT Services=0.028;Banks=0.028;Machinery=0.024;Health Care Equipment & Supplies=0.024;Aerospace & Defense=0.024;Diversified Financial Services=0.022;Media=0.020;Utilities=0.020;Oil, Gas & Consumable Fuels=0.018;Electrical Equipment=0.018;Real Estate Management & Development=0.016;Electronic Equipment, Instruments & Components=0.015;Diversified Telecommunication Services=0.013;Commercial Services & Supplies=0.013;Automobiles=0.012;Tobacco=0.010;Beverages=0.010;Health Care Providers & Services=0.010;Household Products=0.009;Diversified Consumer Services=0.008;Transportation Infrastructure=0.008;Chemicals=0.007;Household Durables=0.006;Metals & Mining=0.006;Road & Rail=0.006;Health Care Technology=0.006;Food Products=0.005;Entertainment=0.004;Air Freight & Logistics=0.004;Building Products=0.004;Industrial Conglomerates=0.003;Technology Hardware, Storage &=0.003;Airlines=0.003;Textiles, Apparel & Luxury Goods=0.002;Ground Transportation=0.001;Containers & Packaging=0.001;Leisure Products=0.001;Trading Companies & Distributors=0.001;Electric Utilities=0.001;Financial Services=0.001;Interactive Media & Services=0.001;Auto Components=0.001;Construction & Engineering=0.000;Distributors=0.000;Professional Services=0.000;Automobile Components=0.000;Construction Materials=0.000;Equity Real Estate Investment=0.000;Life Sciences Tools & Services=0.000;Paper & Forest Products=0.000 | Semiconductors=0.195;Systems Software=0.064;Communications Equipment=0.047;Biotechnology=0.047;Application Software=0.029;Internet Services & Infrastructure=0.026;Diversified Banks=0.026;Aerospace & Defense=0.024;Property & Casualty Insurance=0.023;Consumer Finance=0.022;Electric Utilities=0.017;Hypermarkets & Super Centers=0.017;REIT=0.015;Hotels, Resorts & Cruise Lines=0.014;Construction Machinery & Heavy Trucks=0.014;Electrical Components & Equipment=0.014;Apparel Retail=0.014;Restaurants=0.013;Home Improvement Retail=0.013;Alternative Carriers=0.013;Automobile Manufacturers=0.012;Life Sciences Tools & Services=0.012;Health Care Equipment=0.011;Automotive Retail=0.011;Tobacco=0.010;Asset Management & Custody Banks=0.010;Security & Alarm Services=0.010;Financial Exchanges & Data=0.010;Semiconductor Materials & Equipment=0.010;Electronic Components=0.009;Household Products=0.009;Soft Drinks & Non-alcoholic Beverages=0.009;Investment Banking & Brokerage=0.009;Environmental & Facilities Services=0.008;Highways & Railtracks=0.007;Internet & Direct Marketing Retail=0.007;Trucking=0.006;Integrated Oil & Gas=0.006;Health Care Distributors=0.006;Agricultural & Farm Machinery=0.005;Consumer Electronics=0.005;Health Care Services=0.005;Industrial Machinery & Supplies=0.005;Diversified Support Services=0.005;Heavy Electrical Equipment=0.005;IT Consulting & Other Services=0.005;Cable & Satellite=0.004;Technology Hardware, Storage & Peripherals=0.004;Packaged Foods & Meats=0.004;Movies & Entertainment=0.004;Oil & Gas Exploration & Production=0.004;Managed Health Care=0.004;Air Freight & Logistics=0.004;Building Products=0.004;Data Processing & Outsourced Services=0.004;Life & Health Insurance=0.004;Specialty Chemicals=0.004;Industrial Conglomerates=0.003;Electronic Manufacturing Services=0.003;Technology Hardware, Storage &=0.003;Advertising=0.003;Airlines=0.003;Oil & Gas Storage & Transportation=0.003;Insurance Brokers=0.003;Home Furnishings=0.003;Multi-Utilities=0.003;Diversified Chemicals=0.003;Diversified Metals & Mining=0.003;Electronic Equipment & Instruments=0.003;Oil & Gas Refining & Marketing=0.002;Precious Metals & Minerals=0.002;Railroads=0.002;Interactive Media & Services=0.002;Leisure Products=0.002;Publishing & Broadcasting=0.002;Regional Banks=0.002;Oil & Gas Equipment & Services=0.002;Apparel, Accessories & Luxury Goods=0.002;Research & Consulting Services=0.002;Department Stores=0.002;Homebuilding=0.002;Casinos & Gaming=0.001;Health Care Supplies=0.001;Fertilizers & Agricultural Chemicals=0.001;Steel=0.001;Specialty Stores=0.001;General Merchandise Stores=0.001;Real Estate Services=0.001;Leisure Facilities=0.001;Agricultural Products=0.001;Trading Companies & Distributors=0.001;Distillers & Vintners=0.001;Auto Parts & Equipment=0.001;Health Care Facilities=0.001;Paper Packaging=0.001;Commercial & Residential Mortgage=0.001;Food Retail=0.001;Construction & Engineering=0.000;Metal, Glass & Plastic Containers=0.000;Construction Materials=0.000;Water Utilities=0.000;Commodity Chemicals=0.000;Paper & Plastic Packaging Products & Materials=0.000;Distributors=0.000;Other Specialty Retail=0.000;Independent Power Producers & Energy Traders=0.000;Paper Products=0.000 | 53.27 | 53.31 | 53.29 | 07/23/2026 03:59 PM | 20 | 42 | 62 | 100 | 149 | 249 | 5 | 11 | 16 | 37 | 101 | 138 | -0.06 | USD | f |
| doc | ASSET CLASS | ADVISOR | EXCHANGE | total_net_assets | etfg_date | as_of_date | IPOV TICKER SYMBOL* | fund_ticker | fund_description | MANAGEMENT STYLE: | CUSIP: | fund_isin | LAUNCH DATE: | number_of_holdings_in_etf | market_price | nav | discount_premium | fund_shares_outstanding | TOTAL GROSS EXPENSE RATIO: | thirty_day_median_bid_ask | premium_discount_days_q | premium_discount_days_y | two_per_premium_discount_no_of_days | two_per_premium_discount_5_days | two_per_premium_discount_6_days | two_per_premium_discount_7_days | etf_global_reward_score | etf_global_risk_score | category | focus | development_class | region | geographic_exposure | currency_exposure | sector_exposure | industry_group_exposure | industry_exposure | sub_industry_exposure | last_nb_bid | last_nb_ask | last_nb_mid | last_nb_time | previous_cal_q_pd_premium | previous_cal_q_pd_discount | previous_cal_q_pd_total | previous_cal_y_pd_premium | previous_cal_y_pd_discount | previous_cal_y_pd_total | current_cal_q_pd_premium | current_cal_q_pd_discount | current_cal_q_pd_total | current_cal_y_pd_premium | current_cal_y_pd_discount | current_cal_y_pd_total | discount_premium_in_currency | discount_premium_currency | two_per_premium_discount_7plus_days_in_365_days |
|---|---|---|---|---|---|---|---|---|---|---|---|---|---|---|---|---|---|---|---|---|---|---|---|---|---|---|---|---|---|---|---|---|---|---|---|---|---|---|---|---|---|---|---|---|---|---|---|---|---|---|---|---|---|---|---|---|---|
| ACV ETF Fund Data | Equity | Ridgeline Research, LLC | NYSE Arca, Inc. | 0.00 | 07/23/2026 | 07/23/2026 | ACVF.IV | ACVF | American Conservative Values ETF | 26923N108 | US26923N1081 | 10/29/2020 | 392 | 53.25 | 53.31 | -0.11% | 2,825,000.00 | 0.75 | 0.09% | 62 | 249 | 0 | f | f | f | Strategy | Theme | Developed Markets | North America | US=0.952;IE=0.024;CH=0.009;LU=0.004;CA=0.003;NL=0.002;LR=0.001;JE=0.001;BM=0.000 | USD=0.929 | Technology=0.398;Financials=0.119;Industrials=0.111;Consumer Discretionary=0.102;Health Care=0.086;Consumer Staples=0.054;Communications=0.037;Utilities=0.020;Energy=0.018;Real Estate=0.017;Materials=0.014 | Semiconductors & Semiconductor Equipment=0.204;Software & Services=0.122;Capital Goods=0.075;Technology Hardware & Equipment=0.067;Diversified Financials=0.058;Pharmaceuticals, Biotechnology & Life Sciences=0.052;Retailing=0.047;Consumer Services=0.039;Health Care Equipment & Services=0.034;Insurance=0.030;Banks=0.028;Food, Beverage & Tobacco=0.025;Utilities=0.020;Media & Entertainment=0.020;Energy=0.018;Food & Staples Retailing=0.018;Transportation & Logistics=0.017;Real Estate=0.016;Materials=0.014;Automobiles & Components=0.013;Telecommunication Services=0.013;Commercial & Professional Services=0.011;Consumer Durables & Apparel=0.011;Household & Personal Products=0.009;Transportation=0.004;Technology Hardware & Equipmen=0.003;Financial Services=0.003;Consumer Discretionary Distribution=0.000 | Semiconductors & Semiconductor Equipment=0.204;Software=0.094;Specialty Retail=0.064;Communications Equipment=0.047;Biotechnology=0.047;Capital Markets=0.038;Hotels, Restaurants & Leisure=0.030;Insurance=0.030;IT Services=0.028;Banks=0.028;Machinery=0.024;Health Care Equipment & Supplies=0.024;Aerospace & Defense=0.024;Diversified Financial Services=0.022;Media=0.020;Utilities=0.020;Oil, Gas & Consumable Fuels=0.018;Electrical Equipment=0.018;Real Estate Management & Development=0.016;Electronic Equipment, Instruments & Components=0.015;Diversified Telecommunication Services=0.013;Commercial Services & Supplies=0.013;Automobiles=0.012;Tobacco=0.010;Beverages=0.010;Health Care Providers & Services=0.010;Household Products=0.009;Diversified Consumer Services=0.008;Transportation Infrastructure=0.008;Chemicals=0.007;Household Durables=0.006;Metals & Mining=0.006;Road & Rail=0.006;Health Care Technology=0.006;Food Products=0.005;Entertainment=0.004;Air Freight & Logistics=0.004;Building Products=0.004;Industrial Conglomerates=0.003;Technology Hardware, Storage &=0.003;Airlines=0.003;Textiles, Apparel & Luxury Goods=0.002;Ground Transportation=0.001;Containers & Packaging=0.001;Leisure Products=0.001;Trading Companies & Distributors=0.001;Electric Utilities=0.001;Financial Services=0.001;Interactive Media & Services=0.001;Auto Components=0.001;Construction & Engineering=0.000;Distributors=0.000;Professional Services=0.000;Automobile Components=0.000;Construction Materials=0.000;Equity Real Estate Investment=0.000;Life Sciences Tools & Services=0.000;Paper & Forest Products=0.000 | Semiconductors=0.195;Systems Software=0.064;Communications Equipment=0.047;Biotechnology=0.047;Application Software=0.029;Internet Services & Infrastructure=0.026;Diversified Banks=0.026;Aerospace & Defense=0.024;Property & Casualty Insurance=0.023;Consumer Finance=0.022;Electric Utilities=0.017;Hypermarkets & Super Centers=0.017;REIT=0.015;Hotels, Resorts & Cruise Lines=0.014;Construction Machinery & Heavy Trucks=0.014;Electrical Components & Equipment=0.014;Apparel Retail=0.014;Restaurants=0.013;Home Improvement Retail=0.013;Alternative Carriers=0.013;Automobile Manufacturers=0.012;Life Sciences Tools & Services=0.012;Health Care Equipment=0.011;Automotive Retail=0.011;Tobacco=0.010;Asset Management & Custody Banks=0.010;Security & Alarm Services=0.010;Financial Exchanges & Data=0.010;Semiconductor Materials & Equipment=0.010;Electronic Components=0.009;Household Products=0.009;Soft Drinks & Non-alcoholic Beverages=0.009;Investment Banking & Brokerage=0.009;Environmental & Facilities Services=0.008;Highways & Railtracks=0.007;Internet & Direct Marketing Retail=0.007;Trucking=0.006;Integrated Oil & Gas=0.006;Health Care Distributors=0.006;Agricultural & Farm Machinery=0.005;Consumer Electronics=0.005;Health Care Services=0.005;Industrial Machinery & Supplies=0.005;Diversified Support Services=0.005;Heavy Electrical Equipment=0.005;IT Consulting & Other Services=0.005;Cable & Satellite=0.004;Technology Hardware, Storage & Peripherals=0.004;Packaged Foods & Meats=0.004;Movies & Entertainment=0.004;Oil & Gas Exploration & Production=0.004;Managed Health Care=0.004;Air Freight & Logistics=0.004;Building Products=0.004;Data Processing & Outsourced Services=0.004;Life & Health Insurance=0.004;Specialty Chemicals=0.004;Industrial Conglomerates=0.003;Electronic Manufacturing Services=0.003;Technology Hardware, Storage &=0.003;Advertising=0.003;Airlines=0.003;Oil & Gas Storage & Transportation=0.003;Insurance Brokers=0.003;Home Furnishings=0.003;Multi-Utilities=0.003;Diversified Chemicals=0.003;Diversified Metals & Mining=0.003;Electronic Equipment & Instruments=0.003;Oil & Gas Refining & Marketing=0.002;Precious Metals & Minerals=0.002;Railroads=0.002;Interactive Media & Services=0.002;Leisure Products=0.002;Publishing & Broadcasting=0.002;Regional Banks=0.002;Oil & Gas Equipment & Services=0.002;Apparel, Accessories & Luxury Goods=0.002;Research & Consulting Services=0.002;Department Stores=0.002;Homebuilding=0.002;Casinos & Gaming=0.001;Health Care Supplies=0.001;Fertilizers & Agricultural Chemicals=0.001;Steel=0.001;Specialty Stores=0.001;General Merchandise Stores=0.001;Real Estate Services=0.001;Leisure Facilities=0.001;Agricultural Products=0.001;Trading Companies & Distributors=0.001;Distillers & Vintners=0.001;Auto Parts & Equipment=0.001;Health Care Facilities=0.001;Paper Packaging=0.001;Commercial & Residential Mortgage=0.001;Food Retail=0.001;Construction & Engineering=0.000;Metal, Glass & Plastic Containers=0.000;Construction Materials=0.000;Water Utilities=0.000;Commodity Chemicals=0.000;Paper & Plastic Packaging Products & Materials=0.000;Distributors=0.000;Other Specialty Retail=0.000;Independent Power Producers & Energy Traders=0.000;Paper Products=0.000 | 53.27 | 53.31 | 53.29 | 07/23/2026 03:59 PM | 20 | 42 | 62 | 100 | 149 | 249 | 5 | 11 | 16 | 37 | 101 | 138 | -0.06 | USD | f |
| doc | AS OF DATE | NAV ($)** | MARKET PRICE ($)*** | PREMIUM / DISCOUNT (%) | total_net_assets | etfg_date | fund_ticker | fund_description | MANAGEMENT STYLE: | CUSIP: | fund_isin | IPOV TICKER SYMBOL*: | ADVISOR: | LAUNCH DATE: | number_of_holdings_in_etf | EXCHANGE: | fund_shares_outstanding | TOTAL GROSS EXPENSE RATIO: | thirty_day_median_bid_ask | premium_discount_days_q | premium_discount_days_y | two_per_premium_discount_no_of_days | two_per_premium_discount_5_days | two_per_premium_discount_6_days | two_per_premium_discount_7_days | etf_global_reward_score | etf_global_risk_score | ASSET CLASS: | category | focus | development_class | region | geographic_exposure | currency_exposure | sector_exposure | industry_group_exposure | industry_exposure | sub_industry_exposure | last_nb_bid | last_nb_ask | last_nb_mid | last_nb_time | previous_cal_q_pd_premium | previous_cal_q_pd_discount | previous_cal_q_pd_total | previous_cal_y_pd_premium | previous_cal_y_pd_discount | previous_cal_y_pd_total | current_cal_q_pd_premium | current_cal_q_pd_discount | current_cal_q_pd_total | current_cal_y_pd_premium | current_cal_y_pd_discount | current_cal_y_pd_total | discount_premium_in_currency | discount_premium_currency | two_per_premium_discount_7plus_days_in_365_days |
|---|---|---|---|---|---|---|---|---|---|---|---|---|---|---|---|---|---|---|---|---|---|---|---|---|---|---|---|---|---|---|---|---|---|---|---|---|---|---|---|---|---|---|---|---|---|---|---|---|---|---|---|---|---|---|---|---|---|
| ACV ETF Fund Data | 07/23/2026 | 53.31 | 53.25 | -0.11% | 0.00 | 07/23/2026 | ACVF | American Conservative Values ETF | 26923N108 | US26923N1081 | ACVF.IV | Ridgeline Research, LLC | 10/29/2020 | 392 | NYSE Arca, Inc. | 2,825,000.00 | 0.75 | 0.09% | 62 | 249 | 0 | f | f | f | Equity | Strategy | Theme | Developed Markets | North America | US=0.952;IE=0.024;CH=0.009;LU=0.004;CA=0.003;NL=0.002;LR=0.001;JE=0.001;BM=0.000 | USD=0.929 | Technology=0.398;Financials=0.119;Industrials=0.111;Consumer Discretionary=0.102;Health Care=0.086;Consumer Staples=0.054;Communications=0.037;Utilities=0.020;Energy=0.018;Real Estate=0.017;Materials=0.014 | Semiconductors & Semiconductor Equipment=0.204;Software & Services=0.122;Capital Goods=0.075;Technology Hardware & Equipment=0.067;Diversified Financials=0.058;Pharmaceuticals, Biotechnology & Life Sciences=0.052;Retailing=0.047;Consumer Services=0.039;Health Care Equipment & Services=0.034;Insurance=0.030;Banks=0.028;Food, Beverage & Tobacco=0.025;Utilities=0.020;Media & Entertainment=0.020;Energy=0.018;Food & Staples Retailing=0.018;Transportation & Logistics=0.017;Real Estate=0.016;Materials=0.014;Automobiles & Components=0.013;Telecommunication Services=0.013;Commercial & Professional Services=0.011;Consumer Durables & Apparel=0.011;Household & Personal Products=0.009;Transportation=0.004;Technology Hardware & Equipmen=0.003;Financial Services=0.003;Consumer Discretionary Distribution=0.000 | Semiconductors & Semiconductor Equipment=0.204;Software=0.094;Specialty Retail=0.064;Communications Equipment=0.047;Biotechnology=0.047;Capital Markets=0.038;Hotels, Restaurants & Leisure=0.030;Insurance=0.030;IT Services=0.028;Banks=0.028;Machinery=0.024;Health Care Equipment & Supplies=0.024;Aerospace & Defense=0.024;Diversified Financial Services=0.022;Media=0.020;Utilities=0.020;Oil, Gas & Consumable Fuels=0.018;Electrical Equipment=0.018;Real Estate Management & Development=0.016;Electronic Equipment, Instruments & Components=0.015;Diversified Telecommunication Services=0.013;Commercial Services & Supplies=0.013;Automobiles=0.012;Tobacco=0.010;Beverages=0.010;Health Care Providers & Services=0.010;Household Products=0.009;Diversified Consumer Services=0.008;Transportation Infrastructure=0.008;Chemicals=0.007;Household Durables=0.006;Metals & Mining=0.006;Road & Rail=0.006;Health Care Technology=0.006;Food Products=0.005;Entertainment=0.004;Air Freight & Logistics=0.004;Building Products=0.004;Industrial Conglomerates=0.003;Technology Hardware, Storage &=0.003;Airlines=0.003;Textiles, Apparel & Luxury Goods=0.002;Ground Transportation=0.001;Containers & Packaging=0.001;Leisure Products=0.001;Trading Companies & Distributors=0.001;Electric Utilities=0.001;Financial Services=0.001;Interactive Media & Services=0.001;Auto Components=0.001;Construction & Engineering=0.000;Distributors=0.000;Professional Services=0.000;Automobile Components=0.000;Construction Materials=0.000;Equity Real Estate Investment=0.000;Life Sciences Tools & Services=0.000;Paper & Forest Products=0.000 | Semiconductors=0.195;Systems Software=0.064;Communications Equipment=0.047;Biotechnology=0.047;Application Software=0.029;Internet Services & Infrastructure=0.026;Diversified Banks=0.026;Aerospace & Defense=0.024;Property & Casualty Insurance=0.023;Consumer Finance=0.022;Electric Utilities=0.017;Hypermarkets & Super Centers=0.017;REIT=0.015;Hotels, Resorts & Cruise Lines=0.014;Construction Machinery & Heavy Trucks=0.014;Electrical Components & Equipment=0.014;Apparel Retail=0.014;Restaurants=0.013;Home Improvement Retail=0.013;Alternative Carriers=0.013;Automobile Manufacturers=0.012;Life Sciences Tools & Services=0.012;Health Care Equipment=0.011;Automotive Retail=0.011;Tobacco=0.010;Asset Management & Custody Banks=0.010;Security & Alarm Services=0.010;Financial Exchanges & Data=0.010;Semiconductor Materials & Equipment=0.010;Electronic Components=0.009;Household Products=0.009;Soft Drinks & Non-alcoholic Beverages=0.009;Investment Banking & Brokerage=0.009;Environmental & Facilities Services=0.008;Highways & Railtracks=0.007;Internet & Direct Marketing Retail=0.007;Trucking=0.006;Integrated Oil & Gas=0.006;Health Care Distributors=0.006;Agricultural & Farm Machinery=0.005;Consumer Electronics=0.005;Health Care Services=0.005;Industrial Machinery & Supplies=0.005;Diversified Support Services=0.005;Heavy Electrical Equipment=0.005;IT Consulting & Other Services=0.005;Cable & Satellite=0.004;Technology Hardware, Storage & Peripherals=0.004;Packaged Foods & Meats=0.004;Movies & Entertainment=0.004;Oil & Gas Exploration & Production=0.004;Managed Health Care=0.004;Air Freight & Logistics=0.004;Building Products=0.004;Data Processing & Outsourced Services=0.004;Life & Health Insurance=0.004;Specialty Chemicals=0.004;Industrial Conglomerates=0.003;Electronic Manufacturing Services=0.003;Technology Hardware, Storage &=0.003;Advertising=0.003;Airlines=0.003;Oil & Gas Storage & Transportation=0.003;Insurance Brokers=0.003;Home Furnishings=0.003;Multi-Utilities=0.003;Diversified Chemicals=0.003;Diversified Metals & Mining=0.003;Electronic Equipment & Instruments=0.003;Oil & Gas Refining & Marketing=0.002;Precious Metals & Minerals=0.002;Railroads=0.002;Interactive Media & Services=0.002;Leisure Products=0.002;Publishing & Broadcasting=0.002;Regional Banks=0.002;Oil & Gas Equipment & Services=0.002;Apparel, Accessories & Luxury Goods=0.002;Research & Consulting Services=0.002;Department Stores=0.002;Homebuilding=0.002;Casinos & Gaming=0.001;Health Care Supplies=0.001;Fertilizers & Agricultural Chemicals=0.001;Steel=0.001;Specialty Stores=0.001;General Merchandise Stores=0.001;Real Estate Services=0.001;Leisure Facilities=0.001;Agricultural Products=0.001;Trading Companies & Distributors=0.001;Distillers & Vintners=0.001;Auto Parts & Equipment=0.001;Health Care Facilities=0.001;Paper Packaging=0.001;Commercial & Residential Mortgage=0.001;Food Retail=0.001;Construction & Engineering=0.000;Metal, Glass & Plastic Containers=0.000;Construction Materials=0.000;Water Utilities=0.000;Commodity Chemicals=0.000;Paper & Plastic Packaging Products & Materials=0.000;Distributors=0.000;Other Specialty Retail=0.000;Independent Power Producers & Energy Traders=0.000;Paper Products=0.000 | 53.27 | 53.31 | 53.29 | 07/23/2026 03:59 PM | 20 | 42 | 62 | 100 | 149 | 249 | 5 | 11 | 16 | 37 | 101 | 138 | -0.06 | USD | f |
| doc | 30 DAY MEDIAN BID/ASK SPREAD**** | SHARES OUTSTANDING | TOTAL NET ASSETS | etfg_date | NUMBER OF HOLDINGS | AS OF DATE | fund_ticker | fund_description | MANAGEMENT STYLE: | CUSIP: | fund_isin | IPOV TICKER SYMBOL*: | ADVISOR: | LAUNCH DATE: | EXCHANGE: | MARKET PRICE ($)*** | NAV ($)** | PREMIUM / DISCOUNT (%) | TOTAL GROSS EXPENSE RATIO: | premium_discount_days_q | premium_discount_days_y | two_per_premium_discount_no_of_days | two_per_premium_discount_5_days | two_per_premium_discount_6_days | two_per_premium_discount_7_days | etf_global_reward_score | etf_global_risk_score | ASSET CLASS: | category | focus | development_class | region | geographic_exposure | currency_exposure | sector_exposure | industry_group_exposure | industry_exposure | sub_industry_exposure | last_nb_bid | last_nb_ask | last_nb_mid | last_nb_time | previous_cal_q_pd_premium | previous_cal_q_pd_discount | previous_cal_q_pd_total | previous_cal_y_pd_premium | previous_cal_y_pd_discount | previous_cal_y_pd_total | current_cal_q_pd_premium | current_cal_q_pd_discount | current_cal_q_pd_total | current_cal_y_pd_premium | current_cal_y_pd_discount | current_cal_y_pd_total | discount_premium_in_currency | discount_premium_currency | two_per_premium_discount_7plus_days_in_365_days |
|---|---|---|---|---|---|---|---|---|---|---|---|---|---|---|---|---|---|---|---|---|---|---|---|---|---|---|---|---|---|---|---|---|---|---|---|---|---|---|---|---|---|---|---|---|---|---|---|---|---|---|---|---|---|---|---|---|---|
| ACV ETF Fund Data | 0.09% | 2,825,000 | $150,592,275 | 07/23/2026 | 392 | 07/23/2026 | ACVF | American Conservative Values ETF | 26923N108 | US26923N1081 | ACVF.IV | Ridgeline Research, LLC | 10/29/2020 | NYSE Arca, Inc. | 53.25 | 53.31 | -0.11% | 0.75 | 62 | 249 | 0 | f | f | f | Equity | Strategy | Theme | Developed Markets | North America | US=0.952;IE=0.024;CH=0.009;LU=0.004;CA=0.003;NL=0.002;LR=0.001;JE=0.001;BM=0.000 | USD=0.929 | Technology=0.398;Financials=0.119;Industrials=0.111;Consumer Discretionary=0.102;Health Care=0.086;Consumer Staples=0.054;Communications=0.037;Utilities=0.020;Energy=0.018;Real Estate=0.017;Materials=0.014 | Semiconductors & Semiconductor Equipment=0.204;Software & Services=0.122;Capital Goods=0.075;Technology Hardware & Equipment=0.067;Diversified Financials=0.058;Pharmaceuticals, Biotechnology & Life Sciences=0.052;Retailing=0.047;Consumer Services=0.039;Health Care Equipment & Services=0.034;Insurance=0.030;Banks=0.028;Food, Beverage & Tobacco=0.025;Utilities=0.020;Media & Entertainment=0.020;Energy=0.018;Food & Staples Retailing=0.018;Transportation & Logistics=0.017;Real Estate=0.016;Materials=0.014;Automobiles & Components=0.013;Telecommunication Services=0.013;Commercial & Professional Services=0.011;Consumer Durables & Apparel=0.011;Household & Personal Products=0.009;Transportation=0.004;Technology Hardware & Equipmen=0.003;Financial Services=0.003;Consumer Discretionary Distribution=0.000 | Semiconductors & Semiconductor Equipment=0.204;Software=0.094;Specialty Retail=0.064;Communications Equipment=0.047;Biotechnology=0.047;Capital Markets=0.038;Hotels, Restaurants & Leisure=0.030;Insurance=0.030;IT Services=0.028;Banks=0.028;Machinery=0.024;Health Care Equipment & Supplies=0.024;Aerospace & Defense=0.024;Diversified Financial Services=0.022;Media=0.020;Utilities=0.020;Oil, Gas & Consumable Fuels=0.018;Electrical Equipment=0.018;Real Estate Management & Development=0.016;Electronic Equipment, Instruments & Components=0.015;Diversified Telecommunication Services=0.013;Commercial Services & Supplies=0.013;Automobiles=0.012;Tobacco=0.010;Beverages=0.010;Health Care Providers & Services=0.010;Household Products=0.009;Diversified Consumer Services=0.008;Transportation Infrastructure=0.008;Chemicals=0.007;Household Durables=0.006;Metals & Mining=0.006;Road & Rail=0.006;Health Care Technology=0.006;Food Products=0.005;Entertainment=0.004;Air Freight & Logistics=0.004;Building Products=0.004;Industrial Conglomerates=0.003;Technology Hardware, Storage &=0.003;Airlines=0.003;Textiles, Apparel & Luxury Goods=0.002;Ground Transportation=0.001;Containers & Packaging=0.001;Leisure Products=0.001;Trading Companies & Distributors=0.001;Electric Utilities=0.001;Financial Services=0.001;Interactive Media & Services=0.001;Auto Components=0.001;Construction & Engineering=0.000;Distributors=0.000;Professional Services=0.000;Automobile Components=0.000;Construction Materials=0.000;Equity Real Estate Investment=0.000;Life Sciences Tools & Services=0.000;Paper & Forest Products=0.000 | Semiconductors=0.195;Systems Software=0.064;Communications Equipment=0.047;Biotechnology=0.047;Application Software=0.029;Internet Services & Infrastructure=0.026;Diversified Banks=0.026;Aerospace & Defense=0.024;Property & Casualty Insurance=0.023;Consumer Finance=0.022;Electric Utilities=0.017;Hypermarkets & Super Centers=0.017;REIT=0.015;Hotels, Resorts & Cruise Lines=0.014;Construction Machinery & Heavy Trucks=0.014;Electrical Components & Equipment=0.014;Apparel Retail=0.014;Restaurants=0.013;Home Improvement Retail=0.013;Alternative Carriers=0.013;Automobile Manufacturers=0.012;Life Sciences Tools & Services=0.012;Health Care Equipment=0.011;Automotive Retail=0.011;Tobacco=0.010;Asset Management & Custody Banks=0.010;Security & Alarm Services=0.010;Financial Exchanges & Data=0.010;Semiconductor Materials & Equipment=0.010;Electronic Components=0.009;Household Products=0.009;Soft Drinks & Non-alcoholic Beverages=0.009;Investment Banking & Brokerage=0.009;Environmental & Facilities Services=0.008;Highways & Railtracks=0.007;Internet & Direct Marketing Retail=0.007;Trucking=0.006;Integrated Oil & Gas=0.006;Health Care Distributors=0.006;Agricultural & Farm Machinery=0.005;Consumer Electronics=0.005;Health Care Services=0.005;Industrial Machinery & Supplies=0.005;Diversified Support Services=0.005;Heavy Electrical Equipment=0.005;IT Consulting & Other Services=0.005;Cable & Satellite=0.004;Technology Hardware, Storage & Peripherals=0.004;Packaged Foods & Meats=0.004;Movies & Entertainment=0.004;Oil & Gas Exploration & Production=0.004;Managed Health Care=0.004;Air Freight & Logistics=0.004;Building Products=0.004;Data Processing & Outsourced Services=0.004;Life & Health Insurance=0.004;Specialty Chemicals=0.004;Industrial Conglomerates=0.003;Electronic Manufacturing Services=0.003;Technology Hardware, Storage &=0.003;Advertising=0.003;Airlines=0.003;Oil & Gas Storage & Transportation=0.003;Insurance Brokers=0.003;Home Furnishings=0.003;Multi-Utilities=0.003;Diversified Chemicals=0.003;Diversified Metals & Mining=0.003;Electronic Equipment & Instruments=0.003;Oil & Gas Refining & Marketing=0.002;Precious Metals & Minerals=0.002;Railroads=0.002;Interactive Media & Services=0.002;Leisure Products=0.002;Publishing & Broadcasting=0.002;Regional Banks=0.002;Oil & Gas Equipment & Services=0.002;Apparel, Accessories & Luxury Goods=0.002;Research & Consulting Services=0.002;Department Stores=0.002;Homebuilding=0.002;Casinos & Gaming=0.001;Health Care Supplies=0.001;Fertilizers & Agricultural Chemicals=0.001;Steel=0.001;Specialty Stores=0.001;General Merchandise Stores=0.001;Real Estate Services=0.001;Leisure Facilities=0.001;Agricultural Products=0.001;Trading Companies & Distributors=0.001;Distillers & Vintners=0.001;Auto Parts & Equipment=0.001;Health Care Facilities=0.001;Paper Packaging=0.001;Commercial & Residential Mortgage=0.001;Food Retail=0.001;Construction & Engineering=0.000;Metal, Glass & Plastic Containers=0.000;Construction Materials=0.000;Water Utilities=0.000;Commodity Chemicals=0.000;Paper & Plastic Packaging Products & Materials=0.000;Distributors=0.000;Other Specialty Retail=0.000;Independent Power Producers & Energy Traders=0.000;Paper Products=0.000 | 53.27 | 53.31 | 53.29 | 07/23/2026 03:59 PM | 20 | 42 | 62 | 100 | 149 | 249 | 5 | 11 | 16 | 37 | 101 | 138 | -0.06 | USD | f |
LAUNCH DATE:
MANAGEMENT STYLE:
Active
CUSIP:
TOTAL GROSS EXPENSE RATIO:
ASSET CLASS:
EXCHANGE:
ADVISOR:
IPOV TICKER SYMBOL*:
AS OF DATE:
NAV ($)**
MARKET PRICE ($)***
PREMIUM / DISCOUNT (%)
30 DAY MEDIAN BID/ASK SPREAD****
SHARES OUTSTANDING
TOTAL NET ASSETS
NUMBER OF HOLDINGS
*IOPV, or Indicative Optimized Portfolio Value, is a calculation disseminated by the stock exchange that approximates the Fund’s NAV every fifteen seconds throughout the trading day.
**“Net asset value” or “NAV” is determined by adding up the value of all the assets in the fund, including assets and cash, subtracting any liabilities, and then dividing that value by the number of outstanding shares in the ETF.
***Market Price is defined as the official closing price of the ETF share.
****30-Day Median Bid/Ask Percentage Spread Calculation: Based on Rule 6c-11(c)(1)(v), to calculate the median bid-ask spread the fund, (i) identifies the ETF’s NBBO as of the end of each 10-second interval during each trading day of the last 30 calendar days; (ii) divides the difference between each such bid and offer by the midpoint of the NBBO; and (iii) identify the median of those values.
PREMIUM/DISCOUNT
| Number of Days at | Cal. Year 2025 | 1st QTR 2026 | 2nd QTR 2026 |
|---|---|---|---|
| Premium* | 100 | 12 | 20 |
| Discount** | 149 | 48 | 42 |
| TOTAL | 249 | 60 | 62 |
*Premium – The number of trading days the ETF’s closing price exceeds its NAV.
**Discount – The number of trading days the ETF’s closing price is below its NAV.
PERFORMANCE
(as of June 30, 2026)
| . | QTD | 6 MTH | YTD | 1 YR | 2 YR* | 3 YR* | 5 YR* | INCEPTION (1)* |
|---|---|---|---|---|---|---|---|---|
| ACVF (Market) | 14.68% | 10.71% | 10.71% | 16.28% | 15.64% | 17.99% | 12.10% | 16.30% |
| ACVF (NAV) | 14.51% | 10.74% | 10.74% | 16.20% | 15.67% | 18.02% | 12.12% | 16.29% |
| SPTR Index | 15.20% | 10.21% | 10.21% | 22.32% | 18.59% | 20.59% | 13.40% | 17.45% |
| RUSSELL 1000 Index | 15.14% | 10.33% | 10.33% | 22.02% | 18.80% | 20.47% | 12.66% | 16.90% |
(1) Since Inception Returns are annualized and calculated using 10/28/20 NAV and Index Values. *Performance returns for periods greater than one year are annualized.
Performance is shown net of fees. The performance data quoted represents past performance. Past performance does not guarantee future results. The investment return and principal value of an investment will fluctuate so that an investor’s shares, when sold or redeemed, may be worth more or less than their original cost and current performance may be lower or higher than the performance quoted. Performance current to the most recent month-end can be obtained by calling (888) 909-6030.
GROWTH of $10K vs comparable ETFS (2)
(as of June 30, 2026)
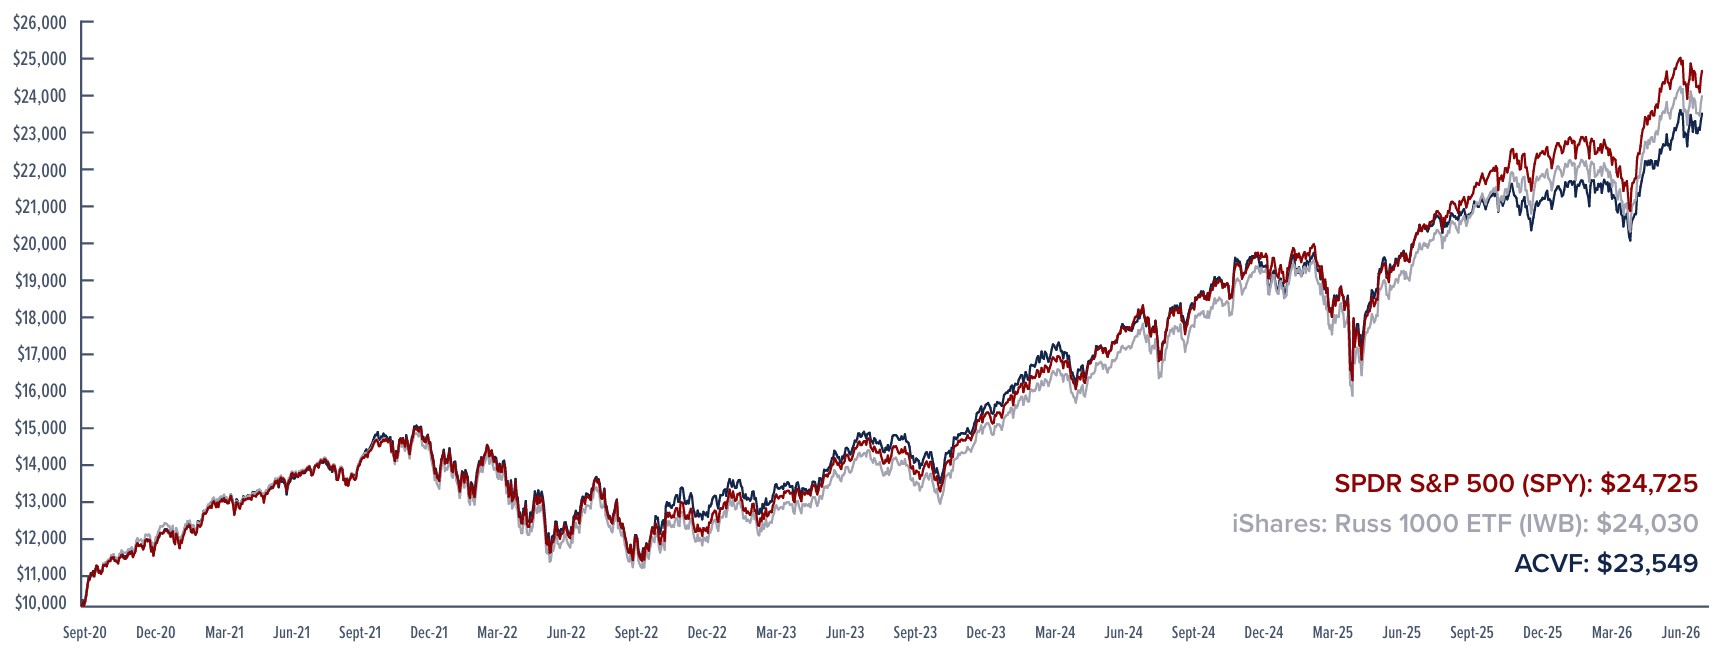
(2) Indexes are un-investable, due to the absence of fees. This comparison uses two widely used large-cap blend ETFs which track the benchmarks used in the performance table. The SPDR® S&P 500® ETF Trust (Ticker: SPY) seeks to provide investment results that correspond generally to the price and yield performance of the S&P 500® Index [SPY Standardized Performance ]. The iShares Russell 1000 ETF (Ticker: IWB) seeks to track the investment results of an index composed of large- and mid-capitalization U.S. equities. [IWB Standardized Performance]. ACVF is an actively managed ETF while SPY & IWB are passively managed index ETFs.
Portfolio Holdings
| Effective Date | Ticker | Holdings Name | Market Value % | Market Value $ | Security ID | Shares / Quantity |
|---|---|---|---|---|---|---|
| 07/23/2026 | NVDA | NVIDIA CORP | 8.19 | $12,337,507 | 67066G104 | 59,099 |
| 07/23/2026 | MSFT | MICROSOFT CORP | 4.19 | $6,310,570 | 594918104 | 16,538 |
| 07/23/2026 | CSCO | CISCO SYSTEMS INC | 2.89 | $4,348,364 | 17275R102 | 38,563 |
| 07/23/2026 | AVGO | Broadcom Inc. | 2.78 | $4,188,832 | 11135F101 | 10,673 |
| 07/23/2026 | LLY | ELI LILLY & CO | 1.75 | $2,631,446 | 532457108 | 2,219 |
| 07/23/2026 | MU | MICRON TECHNOLOGY INC | 1.74 | $2,615,145 | 595112103 | 2,641 |
| 07/23/2026 | WMT | WAL-MART STORES INC | 1.71 | $2,570,923 | 931142103 | 23,717 |
| 07/23/2026 | BRK.B | BERKSHIRE HATHAWAY INC-CL B | 1.63 | $2,451,796 | 84670702 | 4,995 |
| 07/23/2026 | XOM | EXXONMOBIL HOLDINGS CORP COMMON STOCK USD | 1.59 | $2,391,788 | 30233Q108 | 15,245 |
| 07/23/2026 | AMD | ADVANCED MICRO DEVICES INC | 1.53 | $2,304,476 | 7903107 | 4,270 |
| 07/23/2026 | MA | MASTERCARD INC - A | 1.46 | $2,194,340 | 57636Q104 | 4,138 |
| 07/23/2026 | AMAT | APPLIED MATERIALS INC | 1.38 | $2,073,918 | 38222105 | 3,685 |
| 07/23/2026 | ANET | ARISTA NETWORKS INC | 1.30 | $1,963,903 | 40413205 | 11,120 |
| 07/23/2026 | HD | HOME DEPOT INC | 1.18 | $1,772,917 | 437076102 | 5,460 |
| 07/23/2026 | TSLA | Tesla Inc. | 1.06 | $1,591,737 | 88160R101 | 4,979 |
| 07/23/2026 | CAT | CATERPILLAR INC | 1.02 | $1,536,820 | 149123101 | 1,718 |
| 07/23/2026 | ABBV | ABBVIE INC | 1.00 | $1,504,010 | 00287Y109 | 5,854 |
| 07/23/2026 | LRCX | LAM RESH CORP | 0.96 | $1,439,969 | 512807306 | 4,503 |
| 07/23/2026 | TJX | TJX COMPANIES INC | 0.94 | $1,419,230 | 872540109 | 9,247 |
| 07/23/2026 | GLW | CORNING INC | 0.93 | $1,395,957 | 219350105 | 8,945 |
| 07/23/2026 | KLAC | KLA CORPORATION | 0.88 | $1,323,317 | 482480100 | 6,050 |
| 07/23/2026 | INTC | INTEL CORP | 0.86 | $1,300,785 | 458140100 | 12,978 |
| 07/23/2026 | PM | PHILIP MORRIS INTERNATIONAL | 0.77 | $1,153,791 | 718172109 | 6,037 |
| 07/23/2026 | MCD | MCDONALDS CORP | 0.77 | $1,153,429 | 580135101 | 4,389 |
| 07/23/2026 | MRK | MERCK & CO. INC. | 0.75 | $1,122,128 | 58933Y105 | 8,600 |
| 07/23/2026 | GE | GENERAL ELECTRIC CO | 0.74 | $1,121,337 | 369604301 | 3,213 |
| 07/23/2026 | C | CITIGROUP INC | 0.74 | $1,117,155 | 172967424 | 8,471 |
| 07/23/2026 | TMUS | T-MOBILE US INC | 0.74 | $1,115,740 | 872590104 | 6,547 |
| 07/23/2026 | WFC | WELLS FARGO & CO | 0.72 | $1,084,356 | 949746101 | 12,581 |
| 07/23/2026 | SO | SOUTHERN CO/THE | 0.71 | $1,070,908 | 842587107 | 11,086 |
| 07/23/2026 | BKNG | BOOKING HOLDINGS INC | 0.70 | $1,051,325 | 09857L108 | 6,083 |
| 07/23/2026 | ADI | ANALOG DEVICES INC | 0.69 | $1,033,003 | 32654105 | 2,717 |
| 07/23/2026 | PANW | PALO ALTO NETWORKS INC | 0.68 | $1,020,199 | 697435105 | 3,133 |
| 07/23/2026 | TXN | TEXAS INSTRUMENTS INC | 0.67 | $1,008,010 | 882508104 | 3,537 |
| 07/23/2026 | RTX | RTX Corp. | 0.64 | $960,044 | 7.5513E+105 | 4,590 |
| 07/23/2026 | PEP | PEPSICO INC | 0.64 | $957,605 | 713448108 | 7,096 |
| 07/23/2026 | ORCL | ORACLE CORP | 0.63 | $942,074 | 68389X105 | 7,848 |
| 07/23/2026 | PG | PROCTER & GAMBLE CO/THE | 0.61 | $923,266 | 742718109 | 6,282 |
| 07/23/2026 | ABNB | AIRBNB INC | 0.61 | $923,232 | 9066101 | 6,711 |
| 07/23/2026 | ETN | EATON CORP PLC | 0.60 | $897,096 | G29183103 | 2,161 |
| 07/23/2026 | MSI | MOTOROLA SOLUTIONS INC | 0.59 | $881,198 | 620076307 | 2,165 |
| 07/23/2026 | CVX | CHEVRON CORP | 0.57 | $865,363 | 166764100 | 4,451 |
| 07/23/2026 | VRSN | VERISIGN INC | 0.57 | $863,999 | 9.2343E+106 | 3,303 |
| 07/23/2026 | T | AT&T INC | 0.53 | $804,013 | 00206R102 | 35,018 |
| 07/23/2026 | NEE | NEXTERA ENERGY INC | 0.53 | $801,106 | 65339F101 | 8,922 |
| 07/23/2026 | MAR | Marriott International, Inc Class A | 0.53 | $796,002 | 571903202 | 2,184 |
| 07/23/2026 | DE | DEERE & CO | 0.53 | $794,246 | 244199105 | 1,302 |
| 07/23/2026 | UBER | UBER TECHNOLOGIES INC | 0.50 | $760,215 | 90353T100 | 11,032 |
| 07/23/2026 | COF | CAPITAL ONE FINANCIAL CORP | 0.50 | $748,050 | 14040H105 | 3,741 |
| 07/23/2026 | QCOM | QUALCOMM INC | 0.48 | $722,598 | 747525103 | 4,223 |
| 07/23/2026 | CIEN | CIENA CORP | 0.48 | $720,513 | 171779309 | 1,768 |
| 07/23/2026 | MS | MORGAN STANLEY | 0.46 | $689,867 | 617446448 | 3,206 |
| 07/23/2026 | GRMN | GARMIN LTD | 0.45 | $679,963 | H2906T109 | 2,832 |
| 07/23/2026 | SPGI | S&P GLOBAL INC | 0.44 | $666,960 | 78409V104 | 1,588 |
| 07/23/2026 | ROST | ROSS STORES INC | 0.44 | $656,967 | 778296103 | 2,827 |
| 07/23/2026 | HPE | HEWLETT-PACKARD ENTERPRIS | 0.43 | $649,428 | 42824C109 | 13,632 |
| 07/23/2026 | CME | CME GROUP INC | 0.43 | $648,007 | 12572Q105 | 2,548 |
| 07/23/2026 | CDNS | CADENCE DESIGN SYS INC | 0.43 | $643,406 | 127387108 | 1,947 |
| 07/23/2026 | ORLY | OREILLY AUTOMOTIVE INC | 0.43 | $640,745 | 67103H107 | 7,441 |
| 07/23/2026 | SPOT | SPOTIFY TECHNOLOGY SA | 0.42 | $631,730 | L8681T102 | 1,347 |
| 07/23/2026 | UNP | UNION PACIFIC CORP | 0.42 | $626,007 | 907818108 | 2,057 |
| 07/23/2026 | EXPE | EXPEDIA GROUP INC | 0.41 | $616,461 | 30212P303 | 2,393 |
| 07/23/2026 | CB | CHUBB LIMITED | 0.40 | $607,237 | H1467J104 | 1,719 |
| 07/23/2026 | WM | WASTE MANAGEMENT INC | 0.40 | $605,988 | 94106L109 | 2,554 |
| 07/23/2026 | PLTR | PALANTIR TECHNOLOGIES INC. CLASS A | 0.40 | $605,747 | 69608A108 | 4,910 |
| 07/23/2026 | DASH | DOORDASH INC CLASS A | 0.40 | $604,551 | 25809K105 | 3,561 |
| 07/23/2026 | TMO | THERMO FISHER SCIENTIFIC INC | 0.40 | $600,364 | 883556102 | 1,049 |
| 07/23/2026 | GEV | GE VERNOVA LLC | 0.38 | $577,466 | 36828A101 | 560 |
| 07/23/2026 | APH | AMPHENOL CORP-CL A | 0.38 | $576,509 | 32095101 | 3,662 |
| 07/23/2026 | ABT | ABBOTT LABORATORIES COMMON STOCK USD 0 | 0.38 | $575,988 | 2824100 | 5,717 |
| 07/23/2026 | NOW | SERVICENOW INC | 0.36 | $539,780 | 81762P102 | 5,871 |
| 07/23/2026 | MCO | Moodys Corporation | 0.36 | $538,826 | 615369105 | 1,141 |
| 07/23/2026 | PLD | PROLOGIS INC | 0.36 | $535,203 | 74340W103 | 3,688 |
| 07/23/2026 | JBL | JABIL CIRCUIT INC | 0.35 | $520,095 | 466313103 | 1,615 |
| 07/23/2026 | PNC | PNC FINANCIAL SERVICES GROUP | 0.34 | $516,716 | 693475105 | 2,073 |
| 07/23/2026 | SNPS | SYNOPSYS INC | 0.34 | $515,458 | 871607107 | 1,380 |
| 07/23/2026 | STX | SEAGATE TECHNOLOGY-ORDINARY SHARES | 0.34 | $511,482 | G7997R103 | 560 |
| 07/23/2026 | OMC | OMNICOM GROUP | 0.34 | $511,024 | 681919106 | 6,560 |
| 07/23/2026 | ADBE | ADOBE SYSTEMS INC | 0.34 | $507,723 | 00724F101 | 2,393 |
| 07/23/2026 | ISRG | INTUITIVE SURGICAL INC | 0.33 | $500,354 | 46120E602 | 1,507 |
| 07/23/2026 | RSG | REPUBLIC SERVICES INC | 0.33 | $497,457 | 760759100 | 2,288 |
| 07/23/2026 | BMY | BRISTOL-MYERS SQUIBB CO | 0.32 | $479,655 | 110122108 | 7,798 |
| 07/23/2026 | INTU | INTUIT INC | 0.32 | $475,504 | 461202103 | 1,689 |
| 07/23/2026 | MCK | MCKESSON CORP | 0.31 | $474,082 | 58155Q103 | 575 |
| 07/23/2026 | CTAS | CINTAS CORP | 0.31 | $466,865 | 172908105 | 2,297 |
| 07/23/2026 | EA | ELECTRONIC ARTS INC | 0.31 | $462,726 | 285512109 | 2,214 |
| 07/23/2026 | ICE | INTERCONTINENTAL EXCHANGE IN | 0.30 | $456,983 | 45866F104 | 3,191 |
| 07/23/2026 | LMT | LOCKHEED MARTIN CORP | 0.30 | $454,303 | 539830109 | 799 |
| 07/23/2026 | MDLZ | MONDELEZ INTERNATIONAL INC-A | 0.30 | $449,775 | 609207105 | 7,490 |
| 07/23/2026 | CPRT | COPART INC | 0.29 | $441,456 | 217204106 | 16,230 |
| 07/23/2026 | FFIV | F5 Inc | 0.29 | $438,530 | 315616102 | 1,130 |
| 07/23/2026 | CRWD | Crowdstrike Holdings Inc. Class A | 0.29 | $436,540 | 22788C105 | 2,380 |
| 07/23/2026 | ACN | ACCENTURE PLC-CL A | 0.28 | $428,429 | G1151C101 | 3,088 |
| 07/23/2026 | JCI | JOHNSON CONTROLS | 0.28 | $427,864 | G51502105 | 2,986 |
| 07/23/2026 | USB | US BANCORP | 0.28 | $419,878 | 902973304 | 6,630 |
| 07/23/2026 | MNST | MONSTER BEVERAGE CORP | 0.27 | $402,495 | 61174X109 | 4,302 |
| 07/23/2026 | ADP | AUTOMATIC DATA PROCESSING | 0.26 | $390,551 | 53015103 | 1,608 |
| 07/23/2026 | MO | ALTRIA GROUP INC | 0.26 | $388,872 | 02209S103 | 5,395 |
| 07/23/2026 | VRTX | VERTEX PHARMACEUTICALS INC | 0.25 | $383,203 | 92532F100 | 810 |
| 07/23/2026 | CMI | CUMMINS INC | 0.25 | $377,737 | 231021106 | 568 |
| 07/23/2026 | MET | METLIFE INC | 0.25 | $371,641 | 59156R108 | 4,016 |
| 07/23/2026 | BX | BLACKSTONE GROUP INC/THE | 0.25 | $371,508 | 09260D107 | 2,984 |
| 07/23/2026 | ROP | ROPER TECHNOLOGIES INC | 0.25 | $369,680 | 776696106 | 1,041 |
| 07/23/2026 | CSX | CSX CORP | 0.24 | $358,474 | 126408103 | 6,788 |
| 07/23/2026 | EQIX | EQUINIX INC | 0.24 | $355,541 | 29444U700 | 344 |
| 07/23/2026 | TTWO | TAKE-TWO INTERACTIVE SOFTWRE | 0.23 | $350,671 | 874054109 | 1,523 |
| 07/23/2026 | MPC | MARATHON PETROLEUM CORP | 0.23 | $350,367 | 56585A102 | 1,122 |
| 07/23/2026 | CBOE | CBOE HOLDINGS INC | 0.23 | $348,669 | 12503M108 | 1,224 |
| 07/23/2026 | AMGN | AMGEN INC | 0.23 | $347,353 | 31162100 | 935 |
| 07/23/2026 | MDT | MEDTRONIC PLC | 0.23 | $346,082 | G5960L103 | 4,220 |
| 07/23/2026 | FCX | FREEPORT-MCMORAN INC | 0.23 | $345,250 | 35671D857 | 5,437 |
| 07/23/2026 | DHR | DANAHER CORP | 0.23 | $343,228 | 235851102 | 1,783 |
| 07/23/2026 | FTNT | FORTINET INC | 0.23 | $341,723 | 3.4959E+113 | 2,255 |
| 07/23/2026 | PH | PARKER-HANNIFIN CORP COMMON STOCK USD 0.5 | 0.22 | $337,034 | 701094104 | 342 |
| 07/23/2026 | CI | CIGNA CORP | 0.22 | $333,528 | 125523100 | 1,165 |
| 07/23/2026 | AZO | AUTOZONE INC | 0.22 | $333,279 | 53332102 | 114 |
| 07/23/2026 | SYK | STRYKER CORP | 0.22 | $329,177 | 863667101 | 1,032 |
| 07/23/2026 | HONIV | HONEYWELL INTERNATIONAL INC HONIV | 0.21 | $323,353 | 438516205 | 1,313 |
| 07/23/2026 | SCHW | The Charles Schwab Corporation | 0.21 | $317,531 | 808513105 | 3,125 |
| 07/23/2026 | HUM | HUMANA INC | 0.21 | $311,655 | 444859102 | 790 |
| 07/23/2026 | COP | CONOCOPHILLIPS | 0.20 | $299,779 | 20825C104 | 2,494 |
| 07/23/2026 | RH | RH | 0.20 | $299,774 | 74967X103 | 1,805 |
| 07/23/2026 | EMR | EMERSON ELECTRIC CO | 0.20 | $298,784 | 291011104 | 2,062 |
| 07/23/2026 | HLT | HILTON WORLDWIDE | 0.19 | $290,403 | 43300A203 | 907 |
| 07/23/2026 | VSAT | VIASAT INC | 0.19 | $286,014 | 92552V100 | 3,851 |
| 07/23/2026 | CHTR | CHARTER COMMUNICATIONS INC-A | 0.19 | $281,463 | 16119P108 | 2,225 |
| 07/23/2026 | WELL | WELLTOWER INC | 0.19 | $280,155 | 95040Q104 | 1,134 |
| 07/23/2026 | TFC | TRUIST FINANCIAL CORP | 0.18 | $278,118 | 89832Q109 | 5,432 |
| 07/23/2026 | NXPI | NXP Semiconductors NV | 0.18 | $276,735 | N6596X109 | 998 |
| 07/23/2026 | TT | TRANE TECHNOLOGIES PLC | 0.18 | $271,036 | G8994E103 | 565 |
| 07/23/2026 | CL | COLGATE-PALMOLIVE CO | 0.18 | $269,970 | 194162103 | 2,997 |
| 07/23/2026 | MRSH | MARSH & MCLENNAN COS | 0.17 | $262,483 | 571748102 | 1,488 |
| 07/23/2026 | UAL | UNITED AIRLINES HOLDINGS INC | 0.17 | $260,218 | 910047109 | 2,256 |
| 07/23/2026 | ADSK | AUTODESK INC | 0.17 | $258,012 | 52769106 | 1,257 |
| 07/23/2026 | HONAV | HONEYWELL AEROSPACE INC HONAV | 0.17 | $257,177 | 43849R105 | 1,313 |
| 07/23/2026 | RBA | RB GLOBAL INC | 0.17 | $255,762 | 74935Q107 | 2,343 |
| 07/23/2026 | STT | STATE STREET CORP | 0.17 | $250,341 | 857477103 | 1,359 |
| 07/23/2026 | CVS | CVS HEALTH CORP | 0.16 | $242,747 | 126650100 | 2,271 |
| 07/23/2026 | NOC | NORTHROP GRUMMAN CORP | 0.16 | $242,733 | 666807102 | 455 |
| 07/23/2026 | AMP | AMERIPRISE FINANCIAL INC | 0.16 | $238,210 | 03076C106 | 458 |
| 07/23/2026 | PINS | PINTEREST INC- CLASS A | 0.16 | $235,077 | 72352L106 | 10,739 |
| 07/23/2026 | UPS | UNITED PARCEL SERVICE-CL B | 0.15 | $231,395 | 911312106 | 2,028 |
| 07/23/2026 | CASH AND CASH EQUIVALENTS | 0.15 | $226,585 | 226,585 | ||
| 07/23/2026 | TEL | TE CONNECTIVITY LTD | 0.15 | $225,825 | G87052109 | 1,136 |
| 07/23/2026 | REGN | REGENERON PHARMACEUTICALS | 0.15 | $224,909 | 75886F107 | 345 |
| 07/23/2026 | HOOD | ROBINHOOD MARKETS INC | 0.15 | $219,006 | 770700102 | 2,156 |
| 07/23/2026 | FDX | FEDEX CORP | 0.14 | $214,937 | 31428X106 | 681 |
| 07/23/2026 | UI | UBIQUITI INC | 0.14 | $212,803 | 90353W103 | 402 |
| 07/23/2026 | FOXA | FOX CORP - CLASS A | 0.14 | $211,931 | 35137L105 | 3,847 |
| 07/23/2026 | SHW | SHERWIN-WILLIAMS CO/THE | 0.14 | $211,788 | 824348106 | 682 |
| 07/23/2026 | CP | CANADIAN PACIFIC RAILWAY LTD | 0.14 | $209,936 | 13646K108 | 2,274 |
| 07/23/2026 | ECL | ECOLAB INC | 0.14 | $209,723 | 278865100 | 797 |
| 07/23/2026 | EBAY | EBAY INC | 0.14 | $208,473 | 278642103 | 1,907 |
| 07/23/2026 | APP | APPLOVIN CORP | 0.14 | $208,205 | 03831W108 | 522 |
| 07/23/2026 | AMT | AMERICAN TOWER CORP | 0.14 | $207,788 | 03027X100 | 1,262 |
| 07/23/2026 | ELV | ELEVANCE HEALTH INC COMMON STOCK USD 0.01 | 0.14 | $207,862 | 36752103 | 548 |
| 07/23/2026 | COR | Cencora, Inc. | 0.14 | $207,746 | 3.073E+108 | 681 |
| 07/23/2026 | LHX | L3HARRIS TECHNOLOGIES INC | 0.14 | $204,375 | 502431109 | 682 |
| 07/23/2026 | PCAR | PACCAR INC | 0.14 | $204,362 | 693718108 | 1,563 |
| 07/23/2026 | NEM | NEWMONT GOLDCORP CORPORATION COM | 0.14 | $203,743 | 651639106 | 2,151 |
| 07/23/2026 | SLB | SCHLUMBERGER LTD | 0.13 | $202,904 | 806857108 | 4,297 |
| 07/23/2026 | AON | Aon plc | 0.13 | $202,083 | G0403H108 | 568 |
| 07/23/2026 | APD | AIR PRODUCTS & CHEMICALS INC | 0.13 | $201,294 | 9158106 | 684 |
| 07/23/2026 | CTVA | CORTEVA INC-W/I | 0.13 | $201,353 | 22052L104 | 2,268 |
| 07/23/2026 | F | FORD MOTOR CO | 0.13 | $199,727 | 345370860 | 14,115 |
| 07/23/2026 | LIN | LINDE PLC | 0.13 | $196,452 | G54950103 | 388 |
| 07/23/2026 | NUE | NUCOR CORP | 0.13 | $190,267 | 670346105 | 789 |
| 07/23/2026 | ITW | ILLINOIS TOOL WORKS | 0.13 | $188,576 | 452308109 | 681 |
| 07/23/2026 | DUK | DUKE ENERGY CORP | 0.13 | $188,332 | 26441C204 | 1,457 |
| 07/23/2026 | BSX | BOSTON SCIENTIFIC CORP | 0.12 | $184,997 | 101137107 | 4,245 |
| 07/23/2026 | CBRE | CBRE GROUP INC - A | 0.12 | $184,212 | 12504L109 | 1,359 |
| 07/23/2026 | KKR | KKR & CO INC -A | 0.12 | $181,671 | 48251W104 | 1,893 |
| 07/23/2026 | EOG | EOG RESOURCES INC | 0.12 | $181,281 | 26875P101 | 1,246 |
| 07/23/2026 | FITB | FIFTH THIRD BANCORP | 0.12 | $181,223 | 316773100 | 3,171 |
| 07/23/2026 | LYV | LIVE NATION ENTERTAINMENT IN | 0.12 | $179,581 | 538034109 | 1,020 |
| 07/23/2026 | PSA | PUBLIC STORAGE | 0.12 | $178,611 | 74460D109 | 567 |
| 07/23/2026 | FOX | FOX CORP- CLASS B | 0.12 | $178,474 | 35137L204 | 3,629 |
| 07/23/2026 | BNY | BANK OF NEW YORK MELLON CORP | 0.12 | $177,402 | 64058100 | 1,108 |
| 07/23/2026 | ZBRA | ZEBRA TECHNOLOGIES CORP-CL A | 0.12 | $173,441 | 989207105 | 675 |
| 07/23/2026 | CTSH | COGNIZANT TECH SOLUTIONS-A | 0.11 | $172,986 | 192446102 | 4,022 |
| 07/23/2026 | EWBC | EAST WEST BANCORP INC | 0.11 | $172,954 | 27579R104 | 1,324 |
| 07/23/2026 | KMI | KINDER MORGAN INC | 0.11 | $170,666 | 49456B101 | 5,208 |
| 07/23/2026 | SWBI | Smith & Wesson Brands Inc | 0.11 | $170,649 | 831754106 | 11,826 |
| 07/23/2026 | BA | BOEING CO | 0.11 | $165,082 | 97023105 | 789 |
| 07/23/2026 | GILD | GILEAD SCIENCES INC | 0.11 | $164,622 | 375558103 | 1,258 |
| 07/23/2026 | WMB | WILLIAMS COMPANIES INC. | 0.11 | $161,712 | 969457100 | 2,149 |
| 07/23/2026 | COIN | COINBASE GLOBAL INC CLASS A | 0.11 | $161,643 | 19260Q107 | 1,003 |
| 07/23/2026 | OLN | OLIN CORP | 0.11 | $161,508 | 680665205 | 6,832 |
| 07/23/2026 | NTRS | NORTHERN TRUST CORP | 0.11 | $161,045 | 665859104 | 905 |
| 07/23/2026 | RCL | ROYAL CARIBBEAN CRUISES LTD | 0.11 | $160,977 | V7780T103 | 568 |
| 07/23/2026 | VRSK | VERISK ANALYTICS INC | 0.11 | $159,752 | 92345Y106 | 827 |
| 07/23/2026 | FICO | FAIR ISAAC CORP | 0.11 | $159,217 | 303250104 | 132 |
| 07/23/2026 | GPN | GLOBAL PAYMENTS INC | 0.10 | $157,822 | 37940X102 | 2,027 |
| 07/23/2026 | GWW | WW GRAINGER INC | 0.10 | $157,258 | 384802104 | 115 |
| 07/23/2026 | M | MACYS INC | 0.10 | $157,291 | 55616P104 | 6,742 |
| 07/23/2026 | FAST | FASTENAL CO | 0.10 | $157,002 | 311900104 | 3,402 |
| 07/23/2026 | LAD | Lithia Motors Inc | 0.10 | $155,987 | 536797103 | 467 |
| 07/23/2026 | ADM | ARCHER-DANIELS-MIDLAND CO | 0.10 | $153,271 | 39483102 | 1,775 |
| 07/23/2026 | CAH | CARDINAL HEALTH INC | 0.10 | $152,537 | 14149Y108 | 675 |
| 07/23/2026 | MMM | 3M CO | 0.10 | $151,783 | 88579Y101 | 895 |
| 07/23/2026 | NWS | NEWS CORP - CLASS B | 0.10 | $150,892 | 65249B208 | 5,072 |
| 07/23/2026 | KEYS | KEYSIGHT TEC | 0.10 | $147,609 | 49338L103 | 454 |
| 07/23/2026 | NWSA | NEWS CORP - CLASS A | 0.10 | $146,053 | 65249B109 | 5,547 |
| 07/23/2026 | DLR | DIGITAL REALTY TRUST INC | 0.09 | $142,396 | 253868103 | 794 |
| 07/23/2026 | TDG | TRANSDIGM GROUP INC | 0.09 | $138,377 | 893641100 | 114 |
| 07/23/2026 | CFG | CITIZENS FINANCIAL GROUP | 0.09 | $138,071 | 174610105 | 1,923 |
| 07/23/2026 | NMAX | NEWSMAX INC CLASS B | 0.09 | $135,772 | 65250K105 | 17,519 |
| 07/23/2026 | RGR | STURM RUGER & CO INC | 0.09 | $135,265 | 864159108 | 3,554 |
| 07/23/2026 | TSCO | TRACTOR SUPPLY COMPANY | 0.09 | $134,318 | 892356106 | 4,430 |
| 07/23/2026 | WAB | WABTEC CORP | 0.09 | $134,393 | 929740108 | 451 |
| 07/23/2026 | BKR | Baker Hughes Company | 0.09 | $133,270 | 05722G100 | 2,376 |
| 07/23/2026 | EW | EDWARDS LIFESCIENCES CORP | 0.09 | $133,190 | 2.8176E+112 | 1,589 |
| 07/23/2026 | OXY | OCCIDENTAL PETROLEUM CORP | 0.09 | $130,694 | 674599105 | 2,269 |
| 07/23/2026 | HPQ | HP INC | 0.09 | $130,026 | 40434L105 | 5,305 |
| 07/23/2026 | DHI | DR HORTON INC | 0.09 | $129,045 | 23331A109 | 908 |
| 07/23/2026 | GD | GENERAL DYNAMICS CORP | 0.08 | $127,518 | 369550108 | 334 |
| 07/23/2026 | MGM | MGM Resorts International | 0.08 | $127,547 | 552953101 | 2,835 |
| 07/23/2026 | WDAY | WORKDAY INC-CLASS A | 0.08 | $127,231 | 98138H101 | 995 |
| 07/23/2026 | SPG | SIMON PROPERTY GROUP INC | 0.08 | $127,013 | 828806109 | 564 |
| 07/23/2026 | FISV | FISERV INC | 0.08 | $126,824 | 337738108 | 2,538 |
| 07/23/2026 | HCA | HCA HEALTHCARE INC | 0.08 | $126,881 | 40412C101 | 337 |
| 07/23/2026 | CEG | CONSTELLATION ENERGY CORPORATION | 0.08 | $125,398 | 21037T109 | 455 |
| 07/23/2026 | PAYX | PAYCHEX INC | 0.08 | $125,488 | 704326107 | 1,134 |
| 07/23/2026 | RF | REGIONS FINANCIAL CORP | 0.08 | $124,909 | 7591EP100 | 4,074 |
| 07/23/2026 | BDX | BECTON DICKINSON AND CO | 0.08 | $121,611 | 75887109 | 795 |
| 07/23/2026 | DG | DOLLAR GEN CORP NEW | 0.08 | $119,191 | 256677105 | 1,035 |
| 07/23/2026 | W | WAYFAIR INC- CLASS A | 0.08 | $117,571 | 94419L101 | 1,422 |
| 07/23/2026 | STZ | CONSTELLATION BRANDS INC-A | 0.08 | $116,731 | 21036P108 | 903 |
| 07/23/2026 | HIG | HARTFORD FINANCIAL SVCS GRP | 0.08 | $113,033 | 416515104 | 795 |
| 07/23/2026 | RJF | RAYMOND JAMES | 0.08 | $113,141 | 754730109 | 681 |
| 07/23/2026 | WSM | WILLIAMS-SONOMA INC | 0.07 | $112,579 | 969904101 | 515 |
| 07/23/2026 | ETSY | ETSY INC | 0.07 | $110,280 | 29786A106 | 1,363 |
| 07/23/2026 | XEL | XCEL ENERGY INC | 0.07 | $109,847 | 98389B100 | 1,360 |
| 07/23/2026 | AME | AMETEK INC | 0.07 | $108,754 | 31100100 | 451 |
| 07/23/2026 | RKT | ROCKET COS INC CLASS A COMMON STOCK USD.00001 | 0.07 | $106,802 | 77311W101 | 8,357 |
| 07/23/2026 | ODFL | Old Dominion Freight Line Inc. | 0.07 | $105,665 | 679580100 | 458 |
| 07/23/2026 | MANH | MANHATTAN ASSOCIATES INC | 0.07 | $102,611 | 562750109 | 696 |
| 07/23/2026 | LUV | SOUTHWEST AIRLINES CO | 0.07 | $101,313 | 844741108 | 2,266 |
| 07/23/2026 | PEG | PUBLIC SERVICE ENTERPRISE GP | 0.07 | $99,393 | 744573106 | 1,246 |
| 07/23/2026 | WTW | WTW | 0.07 | $98,911 | G96629103 | 343 |
| 07/23/2026 | TPR | TAPESTRY INC COMMON STOCK USD.01 | 0.06 | $94,887 | 876030107 | 682 |
| 07/23/2026 | OKE | ONEOK INC | 0.06 | $94,722 | 682680103 | 1,016 |
| 07/23/2026 | IQV | IQVIA HOLDINGS INC COMMON STOCK USD.01 | 0.06 | $93,916 | 46266C105 | 453 |
| 07/23/2026 | CCI | CROWN CASTLE INTL CORP | 0.06 | $93,138 | 22822V101 | 1,249 |
| 07/23/2026 | DJT | TRUMP MEDIA & TECHNOLOGY | 0.06 | $93,114 | 25400Q105 | 10,474 |
| 07/23/2026 | MCHP | MICROCHIP TECHNOLOGY INC | 0.06 | $92,251 | 595017104 | 1,134 |
| 07/23/2026 | TROW | T ROWE PRICE GROUP INC | 0.06 | $91,385 | 74144T108 | 795 |
| 07/23/2026 | ILMN | ILLUMINA INC | 0.06 | $89,374 | 452327109 | 454 |
| 07/23/2026 | DRI | DARDEN RESTAURANTS INC | 0.06 | $88,713 | 237194105 | 457 |
| 07/23/2026 | TRV | The Travelers Companies Inc. | 0.06 | $88,447 | 8.9417E+113 | 235 |
| 07/23/2026 | CARR | CARRIER GLOBAL CORP-W/I | 0.06 | $86,161 | 14448C104 | 1,246 |
| 07/23/2026 | KMB | Kimberly-Clark Corp | 0.06 | $85,097 | 494368103 | 793 |
| 07/23/2026 | AFL | AFLAC INC | 0.06 | $84,551 | 1055102 | 680 |
| 07/23/2026 | NSC | NORFOLK SOUTHERN CORP | 0.06 | $84,001 | 655844108 | 241 |
| 07/23/2026 | ZTS | ZOETIS INC | 0.06 | $83,891 | 98978V103 | 1,125 |
| 07/23/2026 | CINF | CINCINNATI FINANCIAL CORP | 0.05 | $81,977 | 172062101 | 457 |
| 07/23/2026 | EXPD | EXPEDITORS INTL WASH INC | 0.05 | $80,338 | 302130109 | 456 |
| 07/23/2026 | VLTO | VERALTO CORP-W/I | 0.05 | $80,337 | 92338C103 | 878 |
| 07/23/2026 | AAL | AMERICAN AIRLINES GROUP INC | 0.05 | $79,785 | 02376R102 | 5,886 |
| 07/23/2026 | A | AGILENT TECHNOLOGIES INC | 0.05 | $79,372 | 00846U101 | 568 |
| 07/23/2026 | CNC | CENTENE CORP | 0.05 | $79,229 | 15135B101 | 1,243 |
| 07/23/2026 | WEC | WEC ENERGY GROUP INC | 0.05 | $78,468 | 92939U106 | 684 |
| 07/23/2026 | PPG | PPG INDUSTRIES INC | 0.05 | $77,464 | 693506107 | 681 |
| 07/23/2026 | FIS | FIDELITY NATIONAL INFO SERV | 0.05 | $76,957 | 31620M106 | 1,922 |
| 07/23/2026 | IR | INGERSOLL RAND INC | 0.05 | $76,553 | 45687V106 | 908 |
| 07/23/2026 | KSS | Kohls Corp | 0.05 | $76,549 | 500255104 | 4,206 |
| 07/23/2026 | PWR | QUANTA SERVICES INC | 0.05 | $74,533 | 7.4762E+106 | 114 |
| 07/23/2026 | HAL | HALLIBURTON CO | 0.05 | $73,990 | 406216101 | 2,262 |
| 07/23/2026 | FE | FIRSTENERGY CORP | 0.05 | $72,998 | 337932107 | 1,475 |
| 07/23/2026 | BLDR | BUILDERS FIRSTSOURCE INC | 0.05 | $72,737 | 12008R107 | 1,031 |
| 07/23/2026 | EIX | EDISON INTERNATIONAL | 0.05 | $71,437 | 281020107 | 897 |
| 07/23/2026 | CHRW | C.H. ROBINSON WORLDWIDE INC | 0.05 | $70,901 | 12541W209 | 345 |
| 07/23/2026 | BALL | BALL CORP | 0.05 | $70,569 | 58498106 | 1,134 |
| 07/23/2026 | EQR | EQUITY RESIDENTIAL | 0.05 | $69,714 | 29476L107 | 1,021 |
| 07/23/2026 | GPC | GENUINE PARTS CO | 0.05 | $68,429 | 372460105 | 570 |
| 07/23/2026 | DTE | DTE ENERGY COMPANY | 0.05 | $67,844 | 233331107 | 458 |
| 07/23/2026 | ES | EVERSOURCE ENERGY | 0.04 | $67,680 | 30040W108 | 907 |
| 07/23/2026 | BBY | BEST BUY CO INC | 0.04 | $67,037 | 86516101 | 794 |
| 07/23/2026 | LH | LABCORP HLDGS INC USD 0.1 | 0.04 | $66,353 | 504922105 | 228 |
| 07/23/2026 | DLTR | DOLLAR TREE INC | 0.04 | $66,237 | 256746108 | 563 |
| 07/23/2026 | VTR | Ventas Inc. | 0.04 | $66,096 | 92276F100 | 675 |
| 07/23/2026 | AVB | AVALONBAY COMMUNITIES INC | 0.04 | $65,444 | 53484101 | 343 |
| 07/23/2026 | BWA | BORGWARNER INC | 0.04 | $65,359 | 99724106 | 1,016 |
| 07/23/2026 | L | LOEWS CORP | 0.04 | $64,522 | 540424108 | 558 |
| 07/23/2026 | LYFT | LYFT INC | 0.04 | $64,506 | 55087P104 | 4,601 |
| 07/23/2026 | DXCM | DEXCOM INC | 0.04 | $64,278 | 252131107 | 912 |
| 07/23/2026 | MSCI | MSCI INC | 0.04 | $64,091 | 55354G100 | 116 |
| 07/23/2026 | GEHC | GE HEALTHCARE TECHNOLOG-W/I | 0.04 | $64,036 | 36266G107 | 1,033 |
| 07/23/2026 | LVS | LAS VEGAS SANDS CORP | 0.04 | $62,647 | 517834107 | 1,361 |
| 07/23/2026 | IDXX | IDEXX LABS | 0.04 | $62,566 | 45168D104 | 116 |
| 07/23/2026 | AEP | AMERICAN ELECTRIC POWER | 0.04 | $62,333 | 25537101 | 462 |
| 07/23/2026 | AIG | AMERICAN INTERNATIONAL GROUP | 0.04 | $62,372 | 26874784 | 798 |
| 07/23/2026 | HBAN | HUNTINGTON BANCSHARES INC | 0.04 | $61,109 | 446150104 | 3,512 |
| 07/23/2026 | UA | UNDER ARMOUR INC-CLASS C | 0.04 | $61,076 | 904311206 | 9,268 |
| 07/23/2026 | IT | Gartner Inc | 0.04 | $60,428 | 366651107 | 452 |
| 07/23/2026 | IP | INTERNATIONAL PAPER CO | 0.04 | $60,163 | 460146103 | 1,587 |
| 07/23/2026 | HSY | HERSHEY CO/THE | 0.04 | $59,044 | 427866108 | 343 |
| 07/23/2026 | EFX | EQUIFAX INC | 0.04 | $56,852 | 294429105 | 341 |
| 07/23/2026 | LEN | LENNAR CORP-A | 0.04 | $55,684 | 526057104 | 678 |
| 07/23/2026 | AJG | ARTHUR J GALLAGHER & CO | 0.04 | $55,466 | 363576109 | 229 |
| 07/23/2026 | UAA | UNDER ARMOUR INC-CLASS A | 0.04 | $55,005 | 904311107 | 8,161 |
| 07/23/2026 | ULTA | Ulta Beauty Inc. | 0.04 | $54,965 | 90384S303 | 115 |
| 07/23/2026 | CHD | CHURCH & DWIGHT CO INC | 0.04 | $54,636 | 171340102 | 568 |
| 07/23/2026 | KHC | KRAFT HEINZ CO/THE | 0.04 | $54,625 | 500754106 | 2,154 |
| 07/23/2026 | KEY | KEYCORP | 0.04 | $54,051 | 493267108 | 2,379 |
| 07/23/2026 | PRU | PRUDENTIAL FINANCIAL INC | 0.04 | $53,971 | 744320102 | 458 |
| 07/23/2026 | PKG | Packaging Corp. of America | 0.04 | $53,563 | 695156109 | 229 |
| 07/23/2026 | Q-W US | QNITY ELECTRONICS INC-W/I | 0.04 | $53,523 | 74743L100 | 386 |
| 07/23/2026 | FDXF-W | Fedex Freight Holding Company | 0.03 | $52,629 | 314352105 | 340 |
| 07/23/2026 | ROK | ROCKWELL AUTOMATION INC | 0.03 | $52,514 | 773903109 | 114 |
| 07/23/2026 | EXC | EXELON CORP | 0.03 | $52,481 | 30161N101 | 1,110 |
| 07/23/2026 | YUM | YUM! BRANDS INC | 0.03 | $51,727 | 988498101 | 351 |
| 07/23/2026 | APTV | APTIV HOLDINGS LTD COMMON STOCK USD 0.01 | 0.03 | $50,883 | G3265R107 | 907 |
| 07/23/2026 | CNP | CENTERPOINT ENERGY INC | 0.03 | $50,068 | 15189T107 | 1,132 |
| 07/23/2026 | BR | Broadridge Financial Solutions, Inc. | 0.03 | $49,385 | 11133T103 | 342 |
| 07/23/2026 | PFG | PRINCIPAL FINANCIAL GROUP | 0.03 | $48,831 | 74251V102 | 455 |
| 07/23/2026 | GIS | GENERAL MILLS INC | 0.03 | $48,419 | 370334104 | 1,362 |
| 07/23/2026 | FTV | FORTIVE CORP | 0.03 | $48,314 | 34959J108 | 797 |
| 07/23/2026 | OTIS | OTIS WORLDWIDE CORP-W/I | 0.03 | $47,841 | 68902V107 | 676 |
| 07/23/2026 | D | DOMINION RESOURCES INC/VA | 0.03 | $47,092 | 25746U109 | 659 |
| 07/23/2026 | EL | ESTEE LAUDER | 0.03 | $45,395 | 518439104 | 568 |
| 07/23/2026 | SRE | SEMPRA ENERGY | 0.03 | $45,038 | 816851109 | 482 |
| 07/23/2026 | CDW | CDW CORP/DE | 0.03 | $44,652 | 12514G108 | 343 |
| 07/23/2026 | J | JACOBS SOLUTIONS INC COMMON STOCK | 0.03 | $44,616 | 46982L108 | 338 |
| 07/23/2026 | SYY | SYSCO CORP | 0.03 | $44,625 | 871829107 | 546 |
| 07/23/2026 | KR | KROGER CO | 0.03 | $44,218 | 501044101 | 793 |
| 07/23/2026 | RMD | RESMED INC | 0.03 | $44,135 | 761152107 | 230 |
| 07/23/2026 | PSKY | PARAMOUNT SKYDANCE CORP COMMON STOCK | 0.03 | $43,588 | 69932A204 | 5,134 |
| 07/23/2026 | AMCR | AMCOR PLC | 0.03 | $43,440 | G0250X107 | 1,019 |
| 07/23/2026 | PHM | PULTEGROUP INC | 0.03 | $42,762 | 745867101 | 343 |
| 07/23/2026 | WY | WEYERHAEUSER CO | 0.03 | $42,765 | 962166104 | 1,809 |
| 07/23/2026 | RL | RALPH LAUREN CORP | 0.03 | $42,001 | 751212101 | 113 |
| 07/23/2026 | LYB | LYONDELLBASELL INDUSTRIES NV COMMON STOCK USD 0.04 | 0.03 | $41,784 | N53745100 | 677 |
| 07/23/2026 | WAT | WATERS CORP | 0.03 | $40,918 | 941848103 | 107 |
| 07/23/2026 | INCY | Incyte Corp. | 0.03 | $40,258 | 45337C102 | 345 |
| 07/23/2026 | SOLSV | Solstice Advanced Materials Inc. | 0.03 | $39,998 | 83443Q103 | 657 |
| 07/23/2026 | VEEV | VEEVA SYSTEMS INC-CLASS A | 0.03 | $39,508 | 922475108 | 220 |
| 07/23/2026 | DPZ | Dominos Pizza INC | 0.02 | $36,851 | 25754A201 | 114 |
| 07/23/2026 | O | REALTY INCOME CORP | 0.02 | $35,855 | 756109104 | 554 |
| 07/23/2026 | DD U | DUPONT DE NEMOURS INC NPV | 0.02 | $35,449 | 26614N201 | 258 |
| 07/23/2026 | JBHT | JB Hunt Transport Services, Inc. | 0.02 | $32,988 | 445658107 | 114 |
| 07/23/2026 | MBGL-W | Mobility Global Inc | 0.02 | $32,872 | 60744M106 | 1,588 |
| 07/23/2026 | WYNN | WYNN RESORTS LTD | 0.02 | $32,708 | 983134107 | 338 |
| 07/23/2026 | HST | HOST HOTELS & RESORTS INC | 0.02 | $32,394 | 44107P104 | 1,352 |
| 07/23/2026 | COO | COOPER COS INC | 0.02 | $32,025 | 216648501 | 456 |
| 07/23/2026 | TYL | TYLER TECHNOLOGIES INC | 0.02 | $31,409 | 902252105 | 109 |
| 07/23/2026 | VMC | VULCAN MATERIALS CO | 0.02 | $31,342 | 929160109 | 114 |
| 07/23/2026 | ZBH | ZIMMER BIOMET HOLDINGS INC | 0.02 | $31,378 | 98956P102 | 350 |
| 07/23/2026 | AWK | AMERICAN WATER WORKS CO INC | 0.02 | $30,780 | 30420103 | 229 |
| 07/23/2026 | DOW | DOW INC | 0.02 | $27,903 | 260557103 | 903 |
| 07/23/2026 | BIIB | BIOGEN INC | 0.02 | $26,883 | 09062X103 | 134 |
| 07/23/2026 | XYL | Xylem Inc/NY | 0.02 | $26,763 | 98419M100 | 229 |
| 07/23/2026 | SW | SMURFIT WESTROCK PLC | 0.02 | $24,827 | G8267P108 | 568 |
| 07/23/2026 | MKC | MCCORMICK-N/V | 0.02 | $22,786 | 579780206 | 454 |
| 07/23/2026 | BEN | FRANKLIN RESOURCES INC | 0.01 | $21,828 | 354613101 | 676 |
| 07/23/2026 | POOL | POOL CORP | 0.01 | $20,900 | 73278L105 | 114 |
| 07/23/2026 | MOS | MOSAIC CO/THE | 0.01 | $20,163 | 61945C103 | 905 |
| 07/23/2026 | HAS | HASBRO INC | 0.01 | $20,091 | 418056107 | 230 |
| 07/23/2026 | BBWI | Bath & Body Works Inc | 0.01 | $19,417 | 70830104 | 1,004 |
| 07/23/2026 | RAL-W | RALLIANT CORP RAL-W | 0.01 | $18,567 | 750940108 | 264 |
| 07/23/2026 | SBAC | SBA COMMUNICATIONS CORP | 0.01 | $18,534 | 78410G104 | 106 |
| 07/23/2026 | BF.B | BROWN-FORMAN CORP-CLASS B | 0.01 | $17,707 | 115637209 | 689 |
| 07/23/2026 | PVH | PVH CORP | 0.01 | $17,661 | 693656100 | 227 |
| 07/23/2026 | SOLV | SOLVENTUM CORP W/I COMMON STOCK | 0.01 | $17,225 | 83444M101 | 223 |
| 07/23/2026 | LKQ | LKQ CORP | 0.01 | $16,828 | 501889208 | 678 |
| 07/23/2026 | EXR | EXTRA SPACE STORAGE INC | 0.01 | $16,723 | 30225T102 | 115 |
| 07/23/2026 | IFF | INTERNATIONAL FLAVORS & FRAGRANCES | 0.01 | $16,746 | 459506101 | 227 |
| 07/23/2026 | PHIN | PHINIA Inc. | 0.01 | $16,695 | 71880K101 | 213 |
| 07/23/2026 | SYF | SYNCHRONY FINANCIAL | 0.01 | $16,435 | 87165B103 | 229 |
| 07/23/2026 | PAYC | PAYCOM SOFTWARE INC | 0.01 | $15,812 | 70432V102 | 114 |
| 07/23/2026 | MAA | MID-AMERICA APARTMENT COMM | 0.01 | $15,266 | 59522J103 | 115 |
| 07/23/2026 | ALB | ALBEMARLE CORP | 0.01 | $13,328 | 12653101 | 114 |
| 07/23/2026 | MKTX | MarketAxess Holdings Inc. | 0.01 | $13,031 | 57060D108 | 114 |
| 07/23/2026 | ED | CONSOLIDATED EDISON INC | 0.01 | $12,632 | 209115104 | 112 |
| 07/23/2026 | VGNT-W | VERSIGENT LTD-W/I | 0.01 | $12,447 | G9600F104 | 303 |
| 07/23/2026 | AAP | ADVANCE AUTO PARTS INC | 0.01 | $12,180 | 00751Y106 | 228 |
| 07/23/2026 | AEE | AMEREN CORPORATION | 0.01 | $11,554 | 23608102 | 102 |
| 07/23/2026 | ARE | Alexandria Real Estate Equitie | 0.01 | $11,528 | 15271109 | 230 |
| 07/23/2026 | IVZ | INVESCO LTD | 0.01 | $10,281 | G491BT108 | 345 |
| 07/23/2026 | CLX | CLOROX COMPANY | 0.01 | $10,037 | 189054109 | 107 |
| 07/23/2026 | AES | AES CORP | 0.01 | $10,010 | 00130H105 | 675 |
| 07/23/2026 | MRP-W | MILLROSE PROPERTIES-CL A W/I | 0.01 | $9,417 | 601137102 | 333 |
| 07/23/2026 | AMTM-W | Amentum Holdings Inc | 0.01 | $7,858 | 23939101 | 357 |
| 07/23/2026 | GRAL | GRAIL, LLC | 0.00 | $5,770 | 384747101 | 82 |
| 07/23/2026 | CE | Celanese Corp | 0.00 | $5,445 | 150870103 | 115 |
| 07/23/2026 | FTRE | Fortrea Holdings Inc. | 0.00 | $4,446 | 34965K107 | 228 |
| 07/23/2026 | SLVM | SYLVAMO CORP WHEN ISSUED | 0.00 | $4,575 | 871332102 | 122 |
| 07/23/2026 | FMC | FMC CORP | 0.00 | $1,344 | 302491303 | 115 |
| 07/23/2026 | MTD | METTLER-TOLEDO | 0.00 | $1,332 | 592688105 | 1 |
| 07/23/2026 | EMBC | EMBECTA CORP-W/I | 0.00 | $423 | 29082K105 | 130 |
| 07/23/2026 | 2556706D | SYCAMORE PARTNERS LLC-CVR | 0.00 | $- | 931CVR013 | 2,868 |
| 07/23/2026 | 2602335D | TPG INC - CVR | 0.00 | $- | 436CVR021 | 334 |